 Education is generally thought of as a domestic policy issue. But what can we learn by looking at education on the global scale?
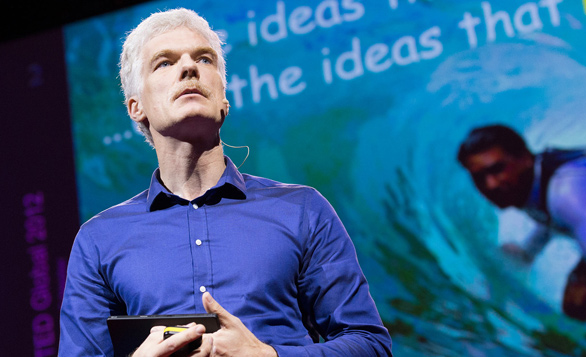
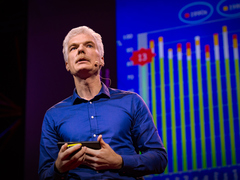 Andreas Schleicher: Use data to build better schools
In today’s talk, given at TEDGlobal 2012, Andreas Schleicher introduces us to a test that measures school systems and student achievement in countries across the globe—PISA (the Programme for International Student Assessment), an initiative of the OECD (Organisation for Economic Co-operation and Development). PISA not only tests students on their mathematical understanding, reading level and ability to apply learning to new problems, but also looks at what teachers get paid, how long the school day is, what the average class size is and whether quality of education is uniform across schools and social stratifications. It even measures cultural attitudes, like whether people in the country expect all students to achieve or only a small segment of them to. It’s this broad approach to data collection that makes PISA so powerful, says Schleicher.
“The test of life is not whether we can remember what we learn in school, but whether we are prepared for change,” says Schleicher. “Whether we are prepared for jobs that haven’t been created and to use technology that haven’t been invented to solve problems we just can’t anticipate today.”
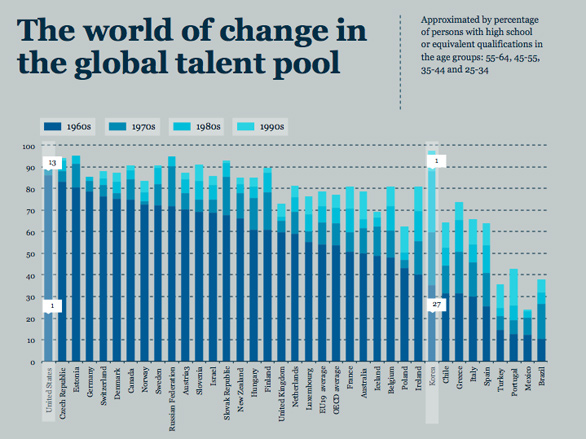 In the 1960s, the United States led the world in the number of students graduating high school. But by the 1990s, it had become 13th—not because their standards dropped, as Schleicher points out, but because so many other countries raised the level of education they were providing. In the same time period, Korea went from number 27 on this measure to number 1. Similarly, in 2000, Germany ranked low on PISA, their scores revealing wide disparity between schools. The ranking kicked off a national debate that forced policymakers to react and, nine years later, their system showed great improvement. The point: that countries are able to make drastic improvements in education in relatively short periods of time. And now, school systems can learn from each other.
“Of course you can’t copy and paste education systems wholesale,” says Schleicher. “But these comparisons have identified a range of factors that high-performing systems share.”
To hear what these factors are, watch this talk. And here, some surprising initial findings that PISA has uncovered.
1. Extracurriculars may not be just extras.
For educators and politicians looking to trim education costs, extracurriculars seem like an obvious place to start. But PISA data suggests that extracurriculars may have direct links to performance. In a PISA survey from 2006, principals were asked about the kinds of science extracurricular activities they provided — like field trips, science fairs and science clubs. And students in schools where these things were commonly offered performed better in science — and this held true even after accounting for socio-economic background. Students in these schools also reported having a greater belief in their ability to tackle science-related problems and simply reported enjoying science more. Read more on the OECD Education Today blog.
2. Big spending does not necessarily make for a better school system.
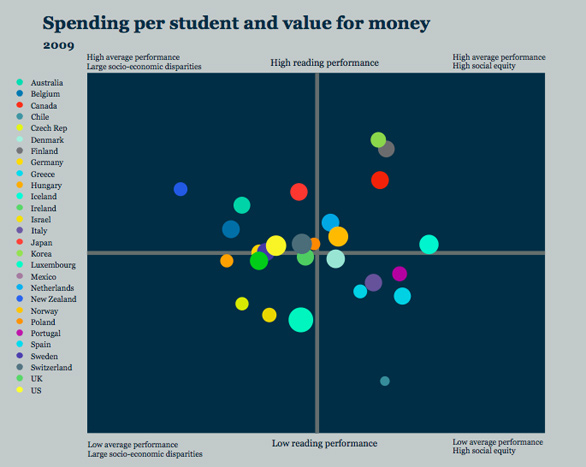
On this graph, which shows PISA’s latest data from 2009, the size of the dot represents how much a country spends per student on education. This is mapped onto a graph that shows reading performance of students and socio-economic disparity seen across student performance. Interestingly, the biggest dots do not rise to the top here. Many of the school systems charting the best on both performance and equity actually spend moderately per student.
In his talk, Schleicher shows how two countries can make very different decisions on how they spend their education dollars. He takes a look at Korea and Luxembourg, which spend comparably. While Korea spends heavily on teacher compensation and development, as well as on having a longer school day, Luxembourg focuses on keeping small class sizes. The point: it’s not what you spend, but how you spend it.
3. Performance-based pay may not make for better teachers.
In a recent study, PISA looked at whether basing teachers’ pay on their effectiveness has results when it comes to student performance. They surveyed school systems where performance determines base salary, annual supplemental payments, and incidental supplemental payments. Overall, there appeared to be no relationship between student performance and whether teachers receiving one of these kinds of performance-based pay. However, when the countries were divided into nations where teachers are low paid (recieving less than 15% of the GDP per capita) versus ones where teachers are well paid (getting more than 15% of the GDP per capita), a pattern emerged. In countries where teachers are low-paid but have a performance-based pay system in place, students performed better on PISA measures. However, in countries where teachers are well paid and performance-based pay system was used, students actually performed worse. Read more on the OECD Education Today blog.
4. Private schools are not across the board better than public schools.
It’s a question many parents want answered: will my child get a better education at a public or private school? The answer is that it depends. Analysis of PISA data shows that students in private schools do tend to perform better than students who attend public schools. However, there are several important caveats. When they controlled for socio-economic context — i.e. looking at public and private school in the same social strata — students performed equally well on PISA measures. And interestingly, in countries with a higher percentage of private schools, students do not perform better overall than those with lower percentages. Read more in PISA On Focus.
Comments (21)
Pingback: 4 удивительных факта об образовании, полученные на основе данных со всего мира | TED RUS
Pingback: Sorpresas de los datos en educación: Para romper esas “verdades” que no siempre son ciertas « Vida Tech «
Pingback: Articles of Interest – February 22, 2013 « National Creativity Network
Pingback: OTR Links 03/10/2013 | doug --- off the record
Pingback: PISA Talks About Factors For Improving Education » Daniel Cernea
Pingback: 'Big Data' measures & rates education systems around the world | Trak Search
Pingback: strategy | Annotary
Pingback: What is the Difference Between an Aspiration and an Expectation? : Social Theory Applied
Pingback: TED-talk van PISA-topman Andreas Schleicher: Use data to build better schools | X, Y of Einstein?
Pingback: 4 surprising lessons about education from data collected around the … | onderwijsNL
Pingback: Articles à lire - perso | Annotary
Pingback: More Than Words | Beyond Complicated
Pingback: What can we learn by looking at education on the global scale? « Aprender a Enseñar