Photo: Dian Lofton.
Danish political scientist Bjørn Lomborg focuses on using economic methods and data to prioritize the world’s problems. In 2005, he gave a TED Talk, Global priorities bigger than climate change, in which he challenged the audience to decide how they might spend $50 billion to solve the pressing issues of our time. Now he’s back, with a new book, How Much Have Global Problems Cost the World?, in which he applies a similar “scorecard” methodology to try to quantify how much various problems have cost the world in terms of GDP since 1900 (projected through to 2050). His conclusion: The world is getting better and the naysayers should rein in the doomsday talk.
Recently, we invited Lomborg to speak at a salon in the TED office in New York. The result was a challenging talk that sparked a lively discussion among our team. And not least for this viewer, a certain amount of number blindness and econo-confusion. You’ll find the talk below (and can weigh in on a conversation with your opinions), while I called Lomborg to get a little help understanding his thinking and methods. See the Q&A, an edited version of our conversation, below the talk.
[youtube=http://www.youtube.com/watch?v=uU-LTKOJY9M&w=560&h=315]
Why did you pick GDP as a metric? How is that valid when you’re measuring more qualitative things that won’t really factor in GDP?
We wanted to compare problems across areas. Economists usually do that by translating everything into money. Not because we’re money-obsessed, but simply to get a common denominator. So, when a person is illiterate, that person is less productive – that person has forgone a higher income of a specific dollar amount, one in 1900, another in 2013.
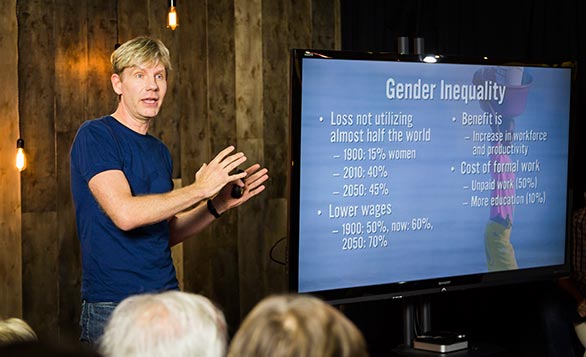
Likewise, when gender inequality barred women from working professionally in the year 1900, that caused a productivity loss (even when taking into account that somebody had to do the housework), and we put a dollar amount on that.
We add up all those losses from illiteracy and gender inequality and those become large dollar amounts (in the billions). But by themselves, the dollar amounts make little intuitive sense. You need to be able to compare them with the resources that were available at the time.
This is why we use GDP. It is by no means a perfect indicator, but it is a good representation of the amount of available resources. The problem expressed as a percentage of GDP shows you how much the problem cost compared to the total resources available to fix it.
Take illiteracy in 1900. We estimate about 70% of all people were illiterate. Had they not been, they would have much more productive. Econometric estimates indicate that without illiteracy, total global income would have been about $240 billion higher in today’s money. Is that a lot of money? It is hard to know, but given that the total global income (GDP) in 1900 was about $2 trillion, I think it is a lot easier to understand if you say that illiteracy cost the world about 12% of its GDP in 1900. Or, had there been no illiteracy, the world would have been 12% richer than it actually was.
I confess, as a non-economist, I did get a little lost in some of the numbers, and maybe diving into some of them will help me to understand your point more. Let’s take human health, which is the first example you give in the talk. You say, “in 1900, the average person produced $1,200 per year, and if you died, that was money the world didn’t get.” Okay, I’m with you so far. You continue, “So take all of those years we’ve died early, say at age 32; multiply it by all the people who died compared to the total world production in 1900; and the answer is 32%.” And now, you lost me.
Basically, what we’re asking is: What’s the loss that you incur by not having good health, by not living as long as you could? As a baseline for a long life, we chose 86 years, because we have good reason to believe that we actually can live to be 86 years on average. In fact, that is what the Japanese are expected to live to be in 2050.
So if you died in 1900 at 32, you’re losing 54 years on average. With an estimated value of $1,200 for each year of life, that is 54 x $1,200 for each person dying.
But wait. There are many reasons that life expectancy was lower in 1900, and many reasons that it’s potentially higher in 2050. How can you take a figure from 2050 and apply it to 1900? And how can you attribute a dollar amount to that?
Absolutely, there were lots of reasons for the lower life expectancy in 1900. But what we’re asking is: what was the cost of bad health? The cost is you die early. The question is how much too early? So, we’re simply estimating how much too soon you die for each year, and valuating each year by the production loss of an average person year.
Okay, I think I understand the earlier figures for literacy and education more than I do those for human health. I guess it seems like there are just so many different contributing factors that go into health. How does this all work when some things are easy to judge and others really aren’t?
I would actually challenge you on that. A lot of things go into illiteracy as well. We couldn’t just have snapped everyone in 1900 out of illiteracy. There are many factors: both your parents’ education, your nutrition, the availability of schoolbooks and teachers, and not to mention that most of us were farmers, so we’d have to go tend the fields instead of school.
What we simply ask is how much better off we would be if everyone had literacy. And likewise, we simply ask how much better off would we be if we all lived to be 86 years old instead of 32.
But isn’t it strange to apply one number from one era to another era altogether and then judge the first era unfavorably for not living up to the standards of later on, even though it didn’t have any of the other advantages of being later? My head hurts!
Ha. Well, I see your problem. But look at it this way. If I showed you statistics that document the average person in 1900 made $1,261 in present-day dollars, and today the average person makes $7,785, this comparison feels entirely correct. We’re more than 6 times richer today than a hundred years ago.
Yet, we’re also comparing very different eras and technologies – they didn’t have the ability to make $7,785 per person back then. One could argue that it is unfair to compare them to such an unrealistic standard. Yet it is also incredibly informative.
It is in this same way that we’re simply comparing the problems of the world in 1900 to later periods.
You’re clear in the talk that double- and triple-counting is problematic. But then you do it anyway. At the end of the talk, you say, “Over the past 113 years, it has gone down to about 40%, and by 2050 will be 27%.” Um, what are you referring to?
If we take all the 10 problems that we looked at and just add them up, then in 1900 we forwent 101% of GDP. We could have been twice as rich in 1900 as we were. And now, we could be 40% richer, and in 2050, we could be 27% richer than we are.
But as it is, you cannot just add them up, because there is likely an excessive amount of double- and triple-counting. The deaths that are ascribed to air pollution would also show up as lack of health and possibly even in malnutrition. It turns out that there is no realistic way to rid the dataset from these doubles and triples.
But it is still likely that the rate of double- and triple-counting is about constant, and that’s why I show the graph. The correct graph would probably look just like the one I showed you, but it would have different and lower numbers. And the main point of the talk, of course, is to show that the general direction is downwards, meaning that we have fixed many, many more problems than we have seen more arise.
So it doesn’t matter so much exactly what the numbers are, but the trend line would look the same.
Precisely.
We should probably touch on global warming, which according to your data is actually a small benefit right now. What about the idea that a lot of the expense of global warming just hasn’t shown up yet?
Oh, yes, global warming will definitely be a problem in the future.
The bottom line is that global warming was not a net problem in the 20th century, and it is not a net problem right now, but, as I say in the talk, it will be a problem in the future, and it’s going to be a net problem towards the end of this century. So definitely, the fact that global warming is a small benefit now does not mean that we shouldn’t do anything about global warming.
In your other work, you make the case that we should look at data and economics and avoid being swayed by emotional PR campaigns or activists showing us pictures of dying animals or melting icecaps. Is that philosophy underpinning your work here? What’s the takeaway for your fellow economists — and for the general public?
Fundamentally, my point is that we have limited resources and we need to spend our money in the best possible way.
That is only possible if we focus on the right things. This project is about bringing the numbers back in, and remembering that even if some things are really, really boring, they can be incredibly important.
I think the takeaway message is that the really big problems for humanity in 1900 were lack of good health, lack of clean air and lack of gender equality. What really mattered was to tackle those three problems, and – even though they’re still big problems and there’s still more to do – the data show that we’ve actually improved health, air and gender equality enormously.
Then I want people to have a sense of proportion. Biodiversity and global warming are smaller problems compared to some of the things that we’re talking about. This doesn’t mean that there are not smart solutions to be had in those areas, and people should pursue those. But my question is whether our conversation is relative to what really matters to humanity?
The final takeaway is that the optimists are mostly right. The world is moving in the right direction. The reason why I think that’s important is that knowing this makes it possible for us to make rational decisions in the rest of the policy sphere. When we think the world is going to hell in a handbasket, we tend to panic, like we’re swept up in a torrent of water threatening to take us over the waterfall’s edge. But if we realize we’re actually moving in the right direction, there’s a better chance we can actually start having a rational conversation about where should we focus next–and figure out where we can get the biggest bang for our buck.
Comments (10)
Pingback: Roundup Oct 3 | Catallaxy Files
Pingback: Bjorn Lomborg Says Global Warming Is A Poor Place To Spend $ | Climate Change Sanity
Pingback: TED Talk by Bjorn Lombord: “The world is getting better and the naysayers should rein in the doomsday talk.” | AEIdeas