You have your fingers in a lot of different pots. What are you up to these days?
I’m working on science visualization at Harvard’s School of Engineering and Applied Sciences. I learned at TEDGlobal 2009 that depending on how I wanted to talk to people, I could answer questions as an astronomer, a physicist, a visualizer of medical imaging, a computer scientist or a student. I’m all of those things. Right now, I’m working on interdisciplinary scientific visualization. I physically am running between the medical school and the astronomy department, and the computer science and physics departments here at Harvard, working to gather data and share all the visualization knowledge.
With so many different subjects, how have you managed to focus your PhD thesis topic?
It’s funny, because I started my thesis pretty narrowly focused on one of the projects I’m participating in called the Multiscale Hemodynamics Project. It’s a big interdisciplinary group of cardiologists, radiologists, computer scientists and physicists working to fundamentally solve heart disease — no small task. We have patients who come in and they get a CT scan and from that we get a 3-D geometry of the patient’s heart and arteries. Then we’re able to do a supercomputer blood flow simulation of the blood going through the heart and the arteries, and we’re essentially able to reanimate the patient’s heart. We can then look at the blood flow and color-code and do all these tricks to show the doctors that there’s a blockage here, in this area there’s a plaque, etc. We’re making it easier for doctors to diagnose a patient.
Right now, the conventional alternative procedure is to perform angiography which requires a doctor to insert a wire up to your heart, inject dye, and then look at 2-D X-ray images of the dye going through. They can only see certain types of blockages, and they can’t see all the plaque, and they can’t see the plaque deposits most likely to cause a heart attack. They then make an educated guess as to where they should put the stent or do angioplasty.
So this whole project’s goal is to make a non-invasive diagnostic tool that gives the doctor way more information than they currently have — and specifically more information about where plaque is going to erupt causing a deadly heart attack.
As I was working on visualization techniques for blood flow, I kept reflecting back to my days doing pure astronomy. As I was pulling in visualization tools from the geosciences and atmospheric science and particle physics, I thought “Oh my gosh, it’s the same thing as in astronomy — this is the same thing! I know 10 astronomers who could be using this same algorithm, this same simulation, this same visualization tool to be studying galaxies, supernovae, dark matter.”
So my PhD thesis now is encompassing fluid-flow visualization across the physical sciences. I’m still working on the blood-flow simulations which incorporate patient-specific heart data imaging, but I’m also working with star-formations astrophysicists, looking at gathering radio telescope data and combining it with fluid-flow simulations of stars forming.
Before going to TEDGlobal, I was much more focused on the biomedical visualization. I gave my three-minute mainstage TED talk on the topic. Afterwards everyone was coming up to me and I realized, “Wow, the rest of the world finds this interesting, it’s useful, why don’t I just do all of this?” So I do credit going to TEDGlobal and talking with all the people afterwards and all the follow-up for pushing me in this new direction.
You said your thesis work kept making you think of your pure astronomy days. How did you first become interested in astronomy?
I was in ninth grade, in high school. I was volunteering in an elementary school science class and I got the chicken pox two days before I was supposed to get the vaccine. And unfortunately when you’re over 12, as I was, you can get these horrible neurological side effects. I got a form of viral meningitis and had the effects of a stroke victim. I could not walk, I couldn’t talk, I had no balance, I was flat in bed. They wanted to hold me back in school, but I wanted to stay with my classmates. So I was home schooled through my ninth grade of high school and I couldn’t read, so I was listening to all my lectures taped in class. And my father bought me a taped collection of Stephen Hawking’s Cambridge lectures. And that is what hooked me. I listened to those tapes over and over and over and over again. I had never known what a black hole was, and general relativity — that was all brand-new to me. It was fascinating. And that’s what really started me down my track.
By coincidence I was also assigned a report on Isaac Newton, inventor of the reflector telescope. So for my visual I built a reflector telescope! When I actually took it outside … oh my gosh, I still remember the first instant I looked through that telescope and saw the moons around Jupiter and the rings on Saturn and my first globular clusters and galaxies. I was hooked.
And, as you can see, I’m out of bed and moving around, so I made a very large recovery for which I was very fortunate.
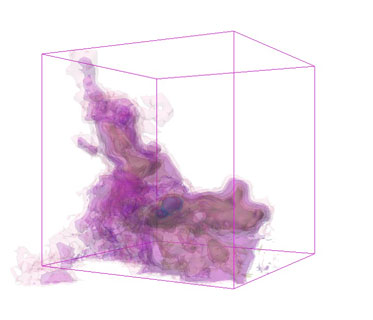
The next phase of my life is how I then got into visualization. At a joint NSF/NIH conference, one of my professors, Alyssa Goodman, talked about astronomy visualization challenges and how astronomers have three- and four-dimensional data from telescopes and do not know how to visualize it. A radiologist in the audience, Michael Halle, realized that an MRI machine has similar data and needs to create similar images. So for my undergraduate thesis I decided to take the astronomy data from the telescope and get it working with the software developed for an MRI scanner to look at patient’s brains in 3-D. And all of a sudden we’re seeing these nebula in 3-D and galaxies in 3-D. No one had ever done this kind of thing.
Based on this work, after graduating from college I started the Astronomical Medicine Project with Professor Goodman and Dr. Halle. And then it was the full-scale effort which we’re still doing and now and my thesis is full steam ahead.
We took the software from the radiology department and the MRI scanner and brought it to the astronomy world and built a plug-in so astronomers can use it. And then, as we were doing this, we realized that in addition to bringing visualization tools from the medical community to the astronomers, the astronomers had data-processing techniques and different strategies for dealing with data that we could bring back to the medical community. There were in fact a lot of projects where both fields had the exact same problem but no solution. So instead of reinventing the wheel or paying twice for the exact same tool, we started building these joint projects where we say we both need to visualize the same type of data in 3-D, so let’s just build it together.
So that started my foray into Astronomical Medicine and visualization. After such a life changing research experience I decided to go to graduate school and say, “Know what? I’m going to do more than pure astronomy. Visualization is too cool. I want to work on the medical side as well, look at geophysics and look at biophysics.” The more I’ve learned about the medical imaging, the more I’ve seen similarities to astronomy and vice versa. Thus the thesis looks at all of this again together, including applying interdisciplinary visualization to the Multiscale Hemodynamics Project.
At what phase is the Multiscale Hemodynamics Project?
Our ultimate end goal is to have a little cart with a rack of GPU computers that we can stick in a room at a hospital or an MRI center. Doctors would then be able to input the patient’s CT data and blood chemistry and in a short time get a whole reconstruction, a reanimation of the heart with all the high-risk areas pre-identified for them to help them make a diagnosis.
Right now we have the simulation working, and we have a couple papers out already validating the simulation and concept. Our next steps including fitting the simulation onto smaller computers for hospital use, continuing to enhance the multiscale physics involved in the simulation, and continuing to improve the visual analysis tools and techniques.
You mentioned that this visualization project can have uses in fields beyond astronomy and medicine.
Even though astronomy and medicine are the fields I’m choosing to focus on because they are very similar, the stuff I’m building and developing is applicable to many other disciplines. When you talk about fluid-flow visualization or the fluid dynamics simulation, be it a star-forming region or blood flow, it’s the same as looking and studying the mantle in the earth, or looking at how heat and energy and water is distributed in a building if you talk with an architect, or dealing with atmospheric modeling and looking at how clouds and weather fronts move around — or even global warming. I really hope in the future to see the work I’m doing applied and used in other disciplines, but also find ways to pull other disciplines into this story.
Is there anything else you’re working on?
I am also interested in stereo imaging — like real 3-D imaging. And I work on that with Alyssa Goodman and Nick Holloman, who’s in Durham, England, at the University of Durham. We’re in a 3-D world, so shouldn’t we look at our data in 3-D as well? And so I’ve had an ongoing collaboration and do a lot of my visualization work in stereo and have a 3-D lenticular laptop, so you don’t need those lovely IMAX style glasses but you can work in 3-D. In addition to 3-D being useful for educational purposes like at museums and universities, it is also useful for science research.
What’s the difference between stereo 3-D and the other type of 3-D?
When I say “stereo” I mean basically: think IMAX. Until this moment, every time I said 3-D I meant it’s a 3-D model but it’s on a flat computer screen. Stereo 3-D is where actually you have IMAX-like setups so it pops out at you in 3-D. Like when you see Harry Potter in a standard IMAX theater and you’re able to put those glasses on, and then the whole movie looks like it’s really in three dimensions. That’s the kind of thing I’m talking about.
You’ve mentioned Broadway musicals are one of your passions. Which is your favorite?
[Laughs] I probably have 10 favorites. I can’t give you one. Probably Les Miserables. And I love Phantom of the Opera and West Side Story, but I also love many others.
You’ve also said you love needle arts. With all you’re working on, do you still find time for them?
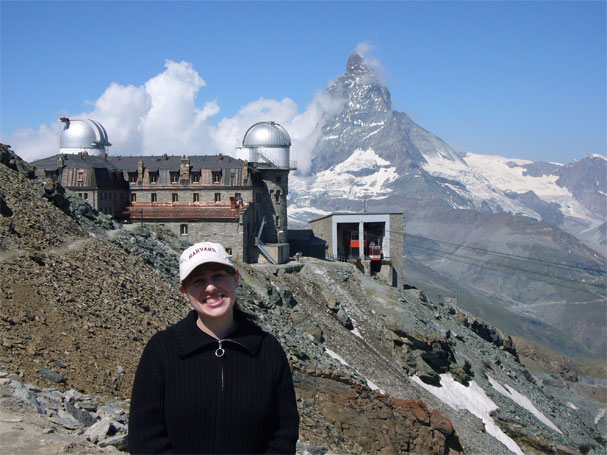
I do. I love doing all the creative stuff. My mom’s a music teacher, my dad’s a computer scientist, so that explains a lot. I do lots of quilting, cross-stitch … I’m currently working on a little cross-stitch of the Matterhorn. I love using the other half of my brain — it’s a major stress reliever.
I also do lots of photography. Not as much as I used to, but I try to make time. I’ve always been a very artsy person. I did studio art and photography and film all through middle school and high school. So it’s interesting to me that my science research now is all very art- and visual-based. And I have no doubt that part of the reason I do visualization is because I love doing art so much.


Comments