Artist Julie Freeman uses data as a source material to make biologically inspired artworks — giving musicality to the movement of fish and expressing city lights in the quiver of moths’ wings. Now she’s finding ways to translate data so that we may gain new perspectives on what it’s trying to tell us.
What do you do?
I make artwork that allows me to be curious about nature in different ways, and to share that curiosity. The driving force behind my work is, generally, What is it about natural systems that are so compelling? How can we understand more about them to get a fresh perspective? And how can we understand phenomena that exist beyond our own sensory perception? That’s where the technology comes in. It allows us to get to grips with hidden elements of biological systems, and can allow us to see or experience things in new ways. In my practice, I use technology as a kind of communication bridge between the natural world and ourselves.
Technology is often seen as something that is at odds with nature, something that tries to control, change, or supercede. My view is that we can use technology to try and understand the natural world better, getting a deeper knowledge of biological systems will allow us to acknowledge and empathise with nature, to garner peace with our environment.
What’s the value of art that translates data?
In addition to exploring how natural systems can be translated, I’m also preoccupied by how much our lives rely on data in the form of data-driven decisions — from the ones that we make personally (think social networks) to those made by our employers, suppliers and governments. It feels important that artists should be working with data not only to reflect what’s happening in the world, but also to help create a level of understanding that in some way reduces fear. The more information is generated, the more our need to understand it grows. We need to be literate to comprehend the interpretations of data that we are being exposed to. And we need to find a way of talking to each other about data that is clear and understandable.
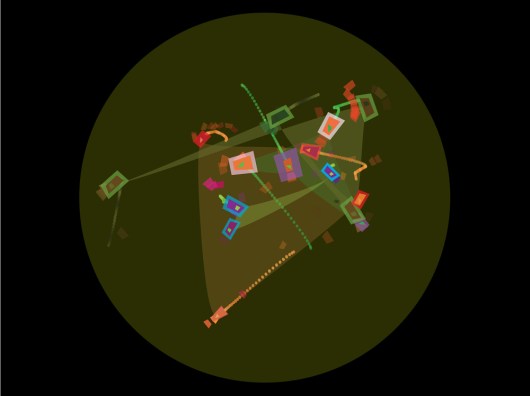
The Lake (2005): A site-specific installation in which 16 freshwater fish were tagged in their natural environment. The tracking data was used to create music and animation display by the lake side in a 80ft tall cylindrical structure — an experience composed by the fish.
For example, there’s a dynamic light sculpture by Fabio Lattanzi Antorini that flickers in response to the number of crimes against humanity being perpetrated. It pulls information from a series of different real-time news feeds, parses them into a sequence and then displays that as a rhythm of light. So although you don’t know any specifics, you do know is that crimes are happening and that it is being monitored. That’s possibly enough to have an awareness without being overwhelmed with detail. Of course it is important that the awareness then leads to change in some way.
It’s no news that there is exponential growth of information. People are trying to tell us their side of the story all the time. It’s overwhelming. We need to find some way of managing that process of absorbing information, and learning from it, without it becoming a pressure. A lot of data-driven artworks do that by condensing information and then giving you a simplified idea.
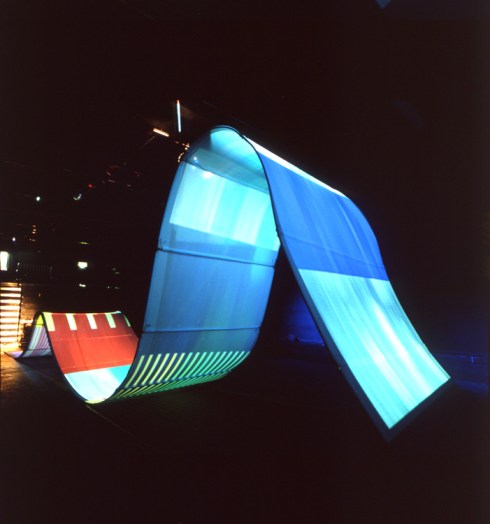
Digital Wave (1998): Participant faces are manipulated and streamed down a giant wave-shaped interactive digital sculpture measuring 45 x 6 x 10 ft.
What made you want to do The Lake project — one of your early works (shown above), where data gathered from the movement of fish in water was translated into animation and sound?
Again, I was curious: I wanted to understand more about the underwater environment and why is it that we’re so fascinated with fish. How does a fish behave in its natural environment? Can the movement and behaviors that fascinate us be translated into art? More personally, part of the reason I wanted to pursue this idea was because I come from a fishing family, and I have fish-like tendencies — I’m an active swimmer, a total water baby. And, being a geek, my artistic tools were technology. It started off as a prototype and then around eight years later became a full-fledged, fully supported project. I let my curiosity out by using technology to get to grips with how fish swim and what their relationship to each other is. I learned a lot from the project, and the data I collected is very unique — I’m still working on further analysis now.
Would you say that your primary interest growing up was biology and the natural world, and then technology just became your tool?
Yeah, I think so. Biology, always. When I was very small, I used to be petrified of animals, anything apparently — cats, rabbits, dogs. My parents got so fed up with my fear that they ended up buying a dog. I remember coming home one day and the dog was in the backyard. I freaked out, screeching “I can’t live here. I can’t live here anymore” — a total drama queen. I was only about six or seven. About an hour later, I was rolling around with the dog. From that point onwards, my whole view of animals shifted completely.
Thinking back on it, I just assumed that these critters were going to bite me or attack me. It was the unpredictability of animals that made me nervous. I guess that was the beginning of wanting to understand more. I’m still interested in critters of any shape and size, but also things at the nanoscale, and more and more, this idea of how biological systems get represented by data, and what if data *was* a biological system? How would we see it if it wasn’t digital? What would it be like if it was akin to something like a slime mold, or nematodes — a living entity?
Why didn’t your curiosity about biology translate into a biology career?
I studied biology through school. I had some issues when I was leaving school age where I ended up being told I couldn’t continue studying at the school, and I had go and do something else. I stumbled into graphic design at the local college, and I took art at the same time. That steered me into the design world, and then I studied design technology at university. Based in the mechanical engineering department it was then that I first started putting together computers and was introduced to the product design world.
It was only when I studied for my Masters in Digital Art, all the concepts I was coming up with linked back to something from the natural world. The idea of tracking fish (later The Lake), my animations about plankton — all my work had a biological element. I got really interested in artificial life systems and how we can mimic life through cellular automata. All the software art that I was developing then was all based on this idea of unpredictability and life systems within the machine. From there I started thinking, well if I’m building them in the machine, how can we start making the software and the hardware connect with the real life systems? It became a fusion of technology and biology in a very literal way.
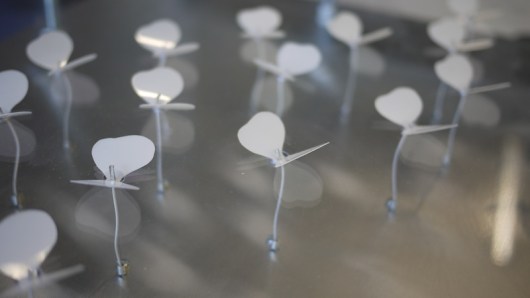
Lepidopteral (2012): A multi-object kinetic artwork that responds to environmental data fluctuations from remote sensors.
Is data then the bridge for that?
Data is a byproduct of our curiosity. Nearly every scientist I know and many artists that work in technology all have this relationship with data where data is the substance that sits between initial curiosity and knowledge and understanding. It plays such an important role. How can data been seen as something that has an ephemeral behavior which changes depending on how you treat or perceive it?
I’ve read and heard people say, “Data is information.” Actually, I don’t think it always is. Data is much more akin to an artwork in some ways, because as a mass it has this potential ambiguity and subjectivity that exists before an analysis happens or before it gets processed in some way. And I think that bit is really quite intriguing.
Do you mean information isn’t information until we interpret the data that’s there?
It’s tricky. I was thinking about this: If all data is information, say, does that mean that everything we see is information? Does it mean that everything has got some kind of message behind it that it is trying to impart which we can then gain knowledge from? And I was trying to think, well if that is true, does it mean that art is information as well? And as soon as art becomes information then suddenly it seems less interesting to me, because I don’t know if it should be information. I think it should be experience. But then could you deconstruct experience into being a process of information gathering? I don’t know. I tied myself up in knots with that one.
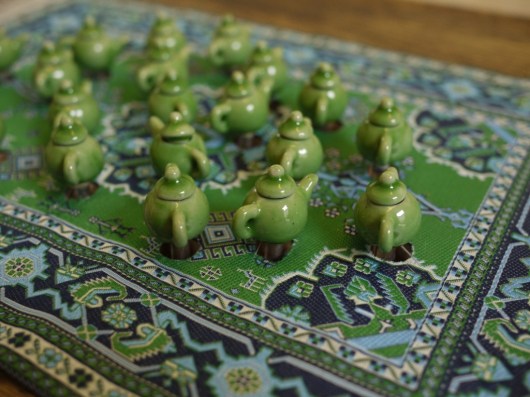
Tea Flock (2011): Migrating rituals and emergent behavior of grouped objects are displayed in this kinetic work, using data from imaginary migratory tea-birds that fly to and from tea-growing countries and the UK.
What types of data you work with?
I’ve worked with all different types. I’ve worked with data that’s been generated by sensors — tracking data. I’ve worked with data that has been collected as sound files and spoken word — sonic data. I’ve worked with data that’s been processed by other people and then delivered either as streams of values or as video feeds. I’ve worked with light levels from different parts of the world. I’ve worked with geographic data about trajectories of bird migration from India and other countries. And I’ve worked with data collected from people. There isn’t any piece of my artwork that hasn’t used data in some way, in some format.
In terms of making art with different types of data, using data as a material, it’s really important to define it so that we know how it manifests within the work. The definitions range from how the data is delivered, where it’s coming from, the temporality of it and also things like: Does it relate to the living world? Is it natural data? Does it relate to the social and political world? Does it relate to a personal individual? Is it economic data? Is it geographic data? Is it generated, real-time or processed data? These are simple descriptions, but they’re important to understand that for data-driven art, the type of data within it can give you a different experience of the work.
How do you go from a sense of curiosity about something to coming up with designing an artwork and making it happen?
To give you one example, a few years back I started making moth capture devices to film moths in action. Sometimes, I’d string up a big white sheet in a woodland and put lights behind it, to attract moths. Every time, nearly every other kind of insect joined the party, and only just one or two moths if any! That made me wonder, if I was a moth, why would I be attracted to light? I wanted to capture, on video, the flickering moth movement.
I went swimming in a lake in Italy and saw what looked like flowers all over the lakeside. But when I looked closer, they were clumps of little lilac butterflies. And they were almost static, they were moving really gently. It was fascinating to watch. Every now and then they’d flit about from clump to clump. I thought, it’s interesting that when you think of a butterfly or a moth, you think of a very flickery, very high-speed flying movement, but actually spend a lot of their time still, just being quite peaceful. These experiences inspired me to make a piece of work, Lepidopteral — these small plastic moth-like creatures that flap in a very organic way in response to light levels in Berlin.
Why Berlin?
Berlin was just a reliable light feed that I found on the Pachube website. It appealed to me to have a remote light level driving the system, a data feed that’s nothing to do with where the work is — and is outside of my control. A lot of my works have this element where I set up a framework using different hardware and software, and then it takes a feed from something — from the environment, or from animals — which directly affects how the artwork performs, whether it’s a sculpture or animation or sound work. It’s not random, but uncontrollable. The work acts as a conduit between something in the environment and something in the gallery or in the studio. When everything gets switched on, I don’t know what’s going to happen, so I don’t know how the final artwork is going to be until it actually comes to life. I’ll spend months, often years, working on these projects, and that’s the moment that really gets me, because I can’t predict it. I also feel like I’ve built something that is communicating in a new way, that it’s not just out of my head, but it’s coming from somewhere else. That’s a great thing to be able to share with people.
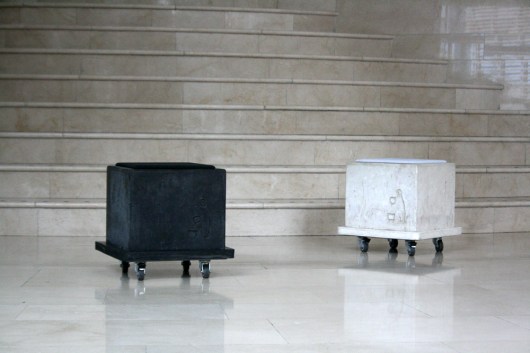
Specious Dialogue (2007): A pair of concrete forms spew an emotional dialogue, they bicker, coo fragments of love, they shout, scream and whisper, they are lonely lovers or clinging siblings. Randomised data produces a conversation that is plausible but false.
What are you working on now?
At the moment, for my PhD I’m working on how we can experience different types of data sets from natural systems through physical objects. I’ll be looking at how those objects relay the essence of data and whether you can determine whether that data is biological, technological or economic, simply through a sense of movement. So it’s kind of like the body language of an artwork in a way. There’ll also be viewer-response feedback mechanisms. So for instance, if you saw a data-driven sculpture that was kind of slumped and it made you feel a bit unsure about why and so you sort of slumped a little bit, then that could be detected and then the object could kind of chirp up a bit, which you’d probably try and mirror, perhaps subconsciously. It’s all very early days.
Will you be making objects for that?
I’ll try! I’m excited because it’s a computer science PhD at Queen Mary, and they’re happy for me to make artworks that explore psychological response to data-driven artwork in a scientific arena, but also in an artistic space as well. We’ll make the artworks and then use them as a stimuli in an experiment and have them as an artwork in a gallery, and see if there’s any link between the two in the way that people perceive the work depending on what context it’s in. It’ll be interesting. It’s quite a challenge to establish whether, if you’re designing an artwork as part of a science experiment, is it still an artwork in itself. Where is the line between rigid design and artistic flow? I think a lot of artworks act the same way as a stimuli in a psychological experiment, even if the artist doesn’t realize that’s what they do.
Tell me about the Open Data Institute show you recently curated.
The Open Data Institute was set up by Sir Tim Berners-Lee and Prof Nigel Shadbolt, and their idea is to create a culture of open data. A key premise behind the institute is to teach people what they can do with open data, and how they can make their data open — all the way from political leadership level to schools and universities and small businesses.
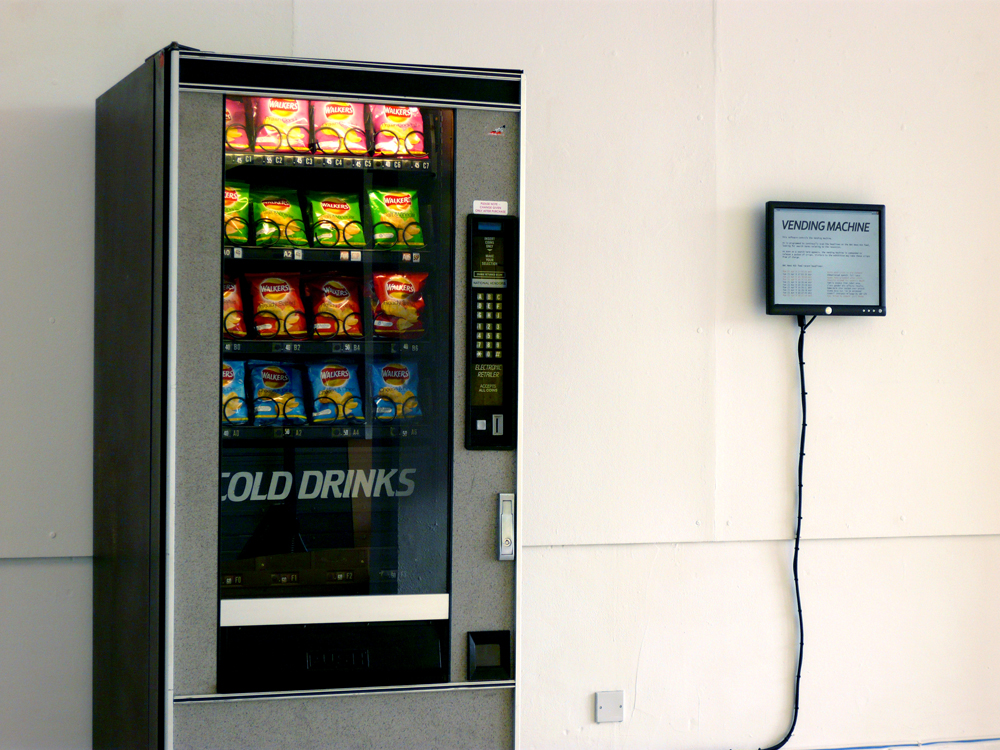
Ellie Harrison’s piece Vending Machine, chosen by Julie Freeman for exhibition at the Open Data Institute, dispenses free crisps in response to recession data. Photo: Ellie Harrison
When I visited their new space in London, I said, “What you need is data-driven artworks.” I was worried that data is seen as dry information, that it’s seen as a very academic or commercial thing. I wanted to make data very tangible for their visitors. We curated and commissioned nine works, nearly all of them are physical pieces. There are a couple of dynamic sculptures. There’s a kinetic wall-based piece, and a painting. There’s a newspaper and an archival book. There is only one piece that is screen-based. It is important to have physical objects in the space, displaying data in a energetic and abstract way. I think the collection we put together surprised them.
What was the response?
The idea of data as a material in an artwork was quite new to those working in the space, so there was some apprehension. As they saw the artists setting work up and building it, they formed a bond with the works because they got to know the people behind them and to understand them quite deeply. Now, the artwork is what everyone talks about. There’s one in particular — by artist Ellie Harrison — an old 1970s vending machine that feeds off of economic data. If there is talk of economic crisis or if there’s a big budget announcement in the news, it dispenses crisps for people to take for free. Staff come in the morning to see if any “recession crisps” have been dispensed, getting a very rapid grasp of the night’s fiscal activity — 10 bags of crisps in the drawer generally means trouble brewing. It’s really interesting to watch that piece in action because it’s a perfect venue for it in a weird way — not many artworks work in a kitchen!
How has the TED fellowship had an effect on you?
Being a Fellow has broadened my ideas about how far I can push things and how important and serious my work is. In practical terms, any question you could have about nearly any subject, you can just email one of the Fellows and they generally know exactly what you need. In terms of resources and opportunities, that is invaluable.
Before I met a lot of the other TED Fellows, I didn’t quite understand where I fitted in — I’m such a kind of mix of things. Being with the TED Fellows, it’s just like: good grief, yeah. It’s completely fine and normal to be doing what I’m doing. Just having that shared knowledge of people all over the world doing the same kind of thing, and being part of that gang, is reassuring. It’s definitely something I carry with me in terms of facing any fears.
Comments (7)
Pingback: What Do All These Women Have in Common? – PS11's H.O.P.
Pingback: Musings of a sound artist on metadata and making art | Collaboration for Research Enhancement by Active Metadata (CREAM)
Pingback: TED Fellows take over the Oval Office, Elon Musk opens Tesla’s patent trove, Sebastian Thrun on the NanoDegree and much more | BizBox B2B Social Site
Pingback: “We Need Us”: Julie Freeman shows new work at the Tate Modern Turbine Hall | TEDFellows Blog
Pingback: Rhythms of starlight, melodies of astrophysics: Fellows Friday with Lucianne Walkowicz | Perry and Pollock
Pingback: Rhythms of starlight, melodies of astrophysics: Fellows Friday with Lucianne Walkowicz | Krantenkoppen Tech
Pingback: Wizmo Blog » Blog Archive » The butterfly effect: Fellows Friday with Julie Freeman