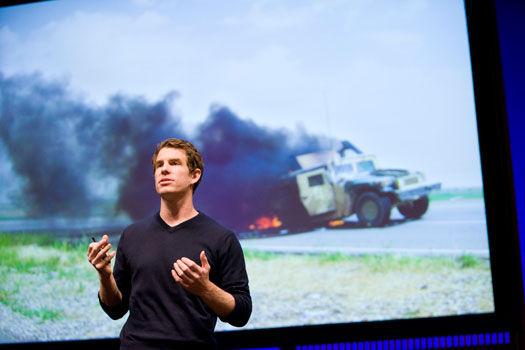
TED Fellow Sean Gourley spoke at TED University 2009 about the mathematics of war — how he and his team of mathematicians, physicists and computer scientists uncovered a strong mathematical relationship linking the fatality and frequency of insurgent attacks.
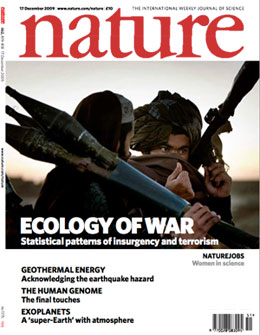
Today, TED is absolutely thrilled to tell you that this research has been published in the prestigious, peer-reviewed scientific journal Nature. (Read the abstract.) The paper, “Common ecology quantifies human insurgency,” proposes a unified mathematical model for human insurgency in violent conflicts.
Below, we’re pleased to present a detailed Q&A with Sean Gourley, where he talks in-depth about the major points in the paper, answering many of the questions people have been asking in the comments on his talk.
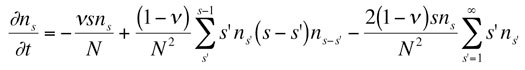
Equation describing the dynamical composition of an insurgency. Here, n_s is the number of groups with strength s, for any s greater than 1. The different terms describe the processes of group coalescence, and group fragmentation.
Describe how you obtained your results.
The research involved a four-step process. First, we compiled a collection of state-of-the-art datasets for a wide range of modern wars. The data came from a range of sources including NGO reports, media streams, governmental databases and social scientists who are experts in specific conflicts. A mosaic approach was used to compile, filter and cross-check the data-sets to ensure accuracy. The result was a database of over 54,000 unique events covering 11 different wars. The data collection method utilized an open-source intelligence methodology.
Second, we used statistical techniques to analyze the data. We found that there was a common pattern in both the size and timing of violent events within modern insurgent wars. We observed this common statistical behavior across multiple different conflicts from Iraq to Sierra Leone, as well as a connection to global terrorism. The existence of these patterns is independent of geography, ideology, politics or religion. Additionally, the mathematical signatures seem to be unique to modern war as they are not observed in older wars such as the American and Spanish civil wars.
Third, we created a model to explain the underlying ecology that gives rise to the statistical distributions seen in modern war. Using innovative computer modeling techniques from statistical physics and the financial markets, we were able to develop the first unified model of insurgency. This model explains the ecology of war. Through it, we can understand the group dynamics of an insurgency, including communication structures and decision making strategies, as well as estimate the total number of opposition groups at any one time.
Our unified model of modern insurgent wars (1) agrees with state-of-the-art data collected for a wide range of wars, (2) challenges traditional ideas of insurgency based on rigid hierarchies and networks, and (3) bears a striking similarity to models of crowd behavior of financial markets (hinting at a possible link between collective human dynamics in violent and non-violent settings).
In the final stage of our research, we examined the strategic and political implications of our findings. We used the model to conduct scenario analysis. Using this technology, we are able to predict what is likely to happen to the length of a war if troops are doubled or how the course of a war may change if a third population of peace-keepers is inserted into the region. We can also observe how a war evolves over time and thereby update strategies to best fight the war given its current state.
How does what this research demonstrates differ from the simple observation that it’s harder to kill more people?
Our statistics show that, across multiple different wars, it is less likely for an attack to kill more people. One explanation for this is that it is simply harder to kill 100 people in an attack than it is to kill 10 people. Whilst this is true, the interesting part of our research is not that it is simply “harder” to kill more people in an attack, but that it is precisely harder to kill more people in an attack. Indeed, our research shows that when alpha equals 2.5 it is 316 times harder for insurgents to kill 100 people in an attack than it is for them to kill 10 people in an attack.
There are many mathematical distributions that can satisfy the requirement “it is harder to kill more people.” These include exponential, logarithmic or simply a straight line with negative slope. But out of all the possible distributions and all the possible parameters, it is the power-law distribution with exponent -2.5 that, to the first order, defines precisely this concept of “harder.”
If we look at the war in Iraq and take a random sample of 2,500 attacks, we find that there are on average ~1,800 attacks that kill 1 person, ~30 attacks that kill 5 people and ~1 attack that kills 20 people. Of particular interest is when we take this same sample of 2,500 attacks from any modern war, we see a very similar ratio emerge. Despite their apparent independence and unpredictability, the insurgent groups kill people in precisely the same ratios.
As scientists, our goal is to extract as much information from the data as possible, thereby moving beyond simple notions. For example, we can say the universe is old, and this is obvious. But saying that the universe is 13.7 billion years old is a much more specific way of describing and understanding that knowledge. With the extra information and detail, we can use it to test the predictive powers of theories that we have. Likewise, in conflict, understanding the specifics of the distribution of attack sizes allow us to formulate theories that explain its existence. These theories are then rigorously testable using the precise distribution that we empirically observe.
Read more: This Q&A with Sean Gourley continues after the jump >>
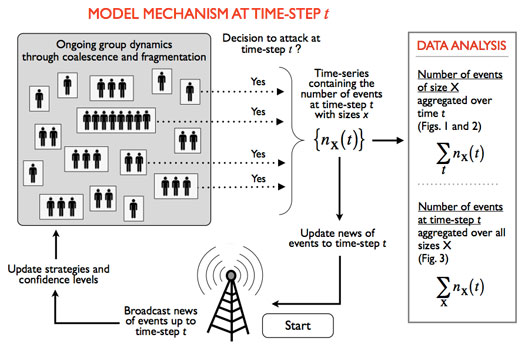
Schematic of the insurgent ecosystem. The insurgent model shown here is driven by a combination of group dynamics, competition and repeated decision making. The cycle of violence allows for strategies to evolve and update over time. The group dynamics of coalescence and fragmentation generate a fluid non-hierarchical network structure that defines insurgent groups across multiple conflicts. (the Fig. references in the schematic refer to the Nature paper)
Can we generalize this to all wars?
In our initial research conducted in 2005, we found common statistical patterns underlying the conflicts in both Iraq and Colombia. Based on these results and the modeling research, we hypothesized that these patterns were a universal property of modern conflict. So, in the last four years, we set out to see if this was in fact true. We have studied nine different modern conflicts in detail and discovered that they all share the same underlying statistical properties, both in the size and the timing of attacks. These conflicts range from 1960s Northern Ireland, to 1990s Colombia and the latest violence in Iraq. In these more “modern” conflicts we have found a remarkably similar set of statistical patterns that govern the behavior of insurgent attacks. However there are some conflicts that do not follow these patterns. Older wars, such as the American and Spanish civil wars, do not share the same statistical patterns as modern war. Thus, there is something quantitatively different about modern conflict. The way insurgents fight and launch attacks today is different from the types of battles seen in the American Civil War.
The difference between these “old” and “new” conflicts is that the majority of conflict today is “asymmetric” in nature, meaning that one side is much stronger and better resourced than the other side. When a small/weak group of people take on a much stronger opposition, they have to find an organizational structure and strategy that will allow them to compete. It turns out that there are only a small number of possible solutions to this problem, and if an insurgent group does not adopt one of these solutions, they generally do not survive.
Our paper in Nature shows not only that modern conflict is different, but also details the intricate dynamics of an insurgent operation. We show how groups form, how they make decisions, how many groups there are, and can estimate their relative strengths. War is different today than it was 100 years ago, and our research moves us a step closer toward understanding it.
Can we apply this research to other types of conflict?
Our research shows that multiple different types of wars share the same set of underlying mathematical signatures. These signatures are independent of political, religious, geographic or ideological differences. We see the same patterns emerge whether we are studying the cocaine-driven conflict in Colombia or the multi-billion dollar war in Iraq. The statistical signatures of both the timing and the sizes of attacks are a result of the underlying forces that drive the insurgent ecosystem. These same forces may be at play in other non-traditional conflict-type systems such as the gangs of Los Angeles, violent crime in Bogotá, and the drug wars in Mexico.
The research shows us that the lines that have traditionally defined the boundaries between organized crime, insurgency and even terrorism, are more blurred than we once thought.
The results of the modeling are also more generally applicable to non-violent competitive ecosystems where there is an asymmetry in force structure. These types of systems include understanding the growth and treatment of cancer, as well as the competition between small startups and established technology companies in Silicon Valley.
It is interesting to note that in the ecosystem of the Somali pirates we can start to see the crossover between startup culture and insurgency. Different pirate groups are funded by a central group that acts to distribute risk and massive returns are possible for successful cells.
Why do you only measure attacks involving casualties? What about other types of attacks — e.g., attacks on infrastructure?
In war, unlike a physics laboratory, it is not easy to run experiments or collect data. Because of the difficulty in collecting information, we need to choose a metric for our analysis that is relatively easy to measure. Casualty data fits this criterion.
We have studied the complete set of attacks for the different wars in our database, and we have found that the vast majority of attacks are not attacks on infrastructure. On average, the success of an attack is well correlated with the number of people killed, so the metric of casualties for our analysis is a good choice.
However not all attacks involve casualties, and the success of an attack is not always well correlated with the number of casualties. For example, an attack on an oil pipeline might generate significant publicity and cause a lot of damage to infrastructure, but only kill a small number of people. These attacks are in the minority, but they still have the potential to tell us something interesting about the nature of the insurgency. We are currently looking into ways to capture this type of information. One proxy for attacks on infrastructure might be the dollar value, or the “cost” of the damage. Another way of capturing non-casualty information might be to analyze the media coverage generated by an attack. By tracking the “cost” or “publicity” metrics, we might find even more statistical patterns that can tell us new things about the insurgent ecosystem.
How can this research help policy or strategy decisions?
This research can help inform policy and strategy decisions in four key ways.
1. Ground-level decision support:
We are able to use our statistical and theoretical models to predict the size and temporal distribution of attacks within a conflict. From this we can predict the likelihood of an attack occurring in a particular region or neighborhood during a specific time window. This information allows logistical decisions to be made, e.g. how many surgeons are needed in a hospital in order to be 90% confident of treating everyone from an attack within six hours.
2. Understanding the insurgent ecosystem:
From our research, we have developed the world’s first quantitative model of the insurgent ecosystem. This model is in close agreement with the latest empirical data collected from across a range of conflicts. Our model allows us to understand the dynamics of insurgent groups, how they form, how they make decisions, how they communicate and how they break apart. We can also estimate the number of autonomous groups or factions within an insurgency and their relative strength.
Policy makers can use these findings to more fully understand the enemy they are dealing with. The research also uncovers and explains a new organizational and decision-making structure that is currently being employed by successful insurgencies around the world. We can learn from insurgent strategies and apply those lessons to the US military structure.
3. Scenario Analysis:
In war, it is difficult to experiment with different strategies. Choosing the wrong strategy will result in unintended consequences may cost many lives. With our model of the insurgent ecosystem, we can test different strategies using simulation. This can be done at a low cost and without the potential loss of life. We can test a range of strategic and policy scenarios, e.g. “What is the likely effect of increasing troop numbers on a conflict’s duration?” or, “What will likely happen to an insurgency if we focus on attacking midsized groups?”
4. Future event planning:
We can use the model to look for early signs of a potential war or insurgency. Or, we can track the fundamental signatures of conflict in real time to see how likely a war is to end within the next 12 months.
Is this type of distribution really common?
It is important to note here that analyzing the data to understand these kinds of statistical distributions is only the first step of the research process. By analyzing the data we are able to find a characteristic signature that starts to define a conflict. This involves advanced statistical testing to reject various different distribution types. When we do this we find that the distribution of deaths within a specific conflict follows a distribution known as a power-law with an exponent clustering around 2.5. However, in many ways, the statistical testing is the easy part of the research. The harder step is to create a theory or a model to explain the existence of this statistical distribution. To do this we need to understand how insurgents form groups, how they make decisions, and how many groups there are. Once the model is completed it is then tested against the empirical evidence to see how it performs. In the Nature paper we repeat this process for the temporal distribution of events, which allows us to build more complex models of insurgent dynamics.
It is through this combination of statistical analyzes and advanced modeling that the value of the research is derived. By doing this we are able to understand the behavior and dynamics that allow an insurgency to take on and often defeat a much larger and better resourced opponent.
What are distributions and specifically what is the significance of a power-law distribution?
A distribution is a collection of events ordered by a single metric (in this case, attack size) and plotted against the frequency. The shape of this distribution is a signal of the underlying processes that govern the system being studied. In our everyday lives the distributions that we are most familiar with are the classic Gaussian or “Bell-shaped curve” class of distributions. These distributions occur in things like the amount of rainfall in a city, or the height of humans. Gaussian curves are well defined by their mean and standard deviation, and people tend to have a good intuitive grasp of concepts such as “above average” and an understanding of the biological or environmental factors that produce these kinds of curves.
A second class of distributions exists that are fundamentally different from the familiar Gaussian distribution. These are known as power-law or scale-free distributions and are defined by the equation p(x)=Cx^-(alpha). Instead of an average and standard deviation, the probability of an event occurring is proportional to the size of the event raised to the power of negative alpha. Whilst these types of distributions are harder to intuitively grasp they do occur in a range of different physical and social systems including earthquake size, financial market returns, the population of cities and book sales.
These power-law type systems have the ability to produce massive events despite the vast majority of events being small in size. Knowing that modern conflict is a system that produces a power-law distribution allows us to understand the types of processes that might govern the behavior of the insurgents. These types of systems are also characterized by a relatively simple set of underlying equations that can produce complex macro level behavior.
Prior to our research no one had observed these types of power-law statistical distributions for the attacks within a specific conflict.
What is the history of quantitative analysis of conflict, and how does your research compare to that done by Lewis Fry Richardson?
Quantitative analysis of conflict is a relatively new discipline that combines data collection, statistical analysis and modeling to understand war and inform political strategy. Our research group brings together an interdisciplinary group of physicists, mathematicians, computer scientists and political economists to use numbers and theoretical models to understand war.
The mathematical analysis of conflict can trace its roots back to the 1940s in the research conducted by Lewis Fry Richardson. Richardson was an ambulance driver in the First World War and was so appalled by what he experienced that he decided to use his time to understand war in an effort to stop it from happening again. Richardson’s work was groundbreaking at the time but seems relatively primitive in today’s context. He used sources such as the encyclopedia Britannica to get estimates of the total number of deaths from different conflicts and then analyzed the dataset, finding that the total number of deaths for each conflict followed a distribution that looked similar to a power-law with exponent 1.5. His research was mostly statistical in nature and couldn’t explain why this pattern might exist.
In 2009, with the rise of the Internet and access to near real-time information from war zones, we are able to return to the quantitative analysis of conflict and look at it in much higher resolution. Whereas Richardson’s analysis looked at entire wars as one data point, today’s information technology infrastructure allows us to “zoom in” to the level of an individual attack. We can also get information not just about the size of the attack, but also when and where it occurred. We can use these new analytic and data tools to analyze the mathematical signature of attacks within a single war, see how it evolves over time and compare the statistical equations across multiple wars.
Although I didn’t get time to talk about it in the seven-minute TED presentation, another component of our Nature research paper addresses the mathematical patterns surrounding the timing of attacks. We ask questions like, how do attacks cluster in time? And, are the attacks truly random in nature? We found that the attacks are not randomly distributed across a conflict; instead, they tend to cluster together. The cause of this clustering is coordination via a global signal and competition amongst groups for media exposure and resources.
The second major difference between our work and that of Richardson is that we take a significant step beyond simply looking for statistical patterns within the attack data. The statistical analysis is only the first step of the process, telling us if there is something interesting to look at. But it doesn’t tell us what caused the pattern to emerge in the first place. In order to explain this we must formulate testable theories and create computer models to compare them to the empirical data. With this modeling step we move beyond a simple “statistics of war” and start considering an “ecology of war,” where we look at the entire ecosystem of a conflict. By taking this modeling approach, we have been able to construct a unified theory of insurgency, or, in other words, a theory that explains how an insurgency functions. This theory accurately replicates the statistical patterns found in the timing and the size of attacks across multiple wars around the world. So far, no one else has even identified these patterns, let alone come up with a theory to explain their emergence. Our modeling approach allows us to understand how an insurgent group functions, to see how it evolves over time and to make informed policy decisions. The simple statistics employed by Richardson do not allow these insights to be drawn.
Another colleague working in this field is Aaron Clauset. His research has focused on understanding the statistics of terrorist attacks. Clauset found that the size of terrorist attacks follow a similar pattern to that which our research found for attacks within wars like Iraq. The interesting thing here is that modern war and terrorism might be more similar than anyone had previously thought. Our model published in Nature is able to explain this similarity by looking at the structure of insurgent groups and comparing that to the structure of terrorist cells. The group dynamics for both insurgents and terrorists seem to be very similar. The work by Clauset provides an independent verification of our model of insurgent dynamics.
What is interesting about Richardson’s work is that the statistical patterns he observed across wars over a 100 year time period are also found within the daily attacks in an individual conflict. This similarity hints at a fractal structure, where the forces shaping attacks on a day-to-day level are similar in nature to the forces shaping geo-politics and wars over the period of decades. This fractal behavior is certainly something worth investigating further.
Can we trust the media as a source of data?
This is a good question, and a very important one. We should all be asking how well do the media cover conflict. As part of our research we have looked very closely at the way media reports on events within a warzone. We have studied how they cover stories of violence and analyzed the level of coverage they provide. What we have found is that no one news source has complete coverage, but the combination of multiple news sources produces a high level of coverage with some overlap between each stream.
Before we go on, it is important to emphasize a couple of key features of our database. Firstly, the data collected from media streams forms only part of the database. The rest of the database is built using a combination of NGO reports, governmental databases and studies from social scientists that are experts in specific conflicts. A mosaic approach was used to compile, filter, and crosscheck the data sets to ensure accuracy. The result is a database of over 54,000 unique events covering 11 different wars.
The second point to emphasize is that when we talk about media we are not just talking about one media source, rather we are using multiple sources. For Iraq we have over 100 different media streams that we monitor and these streams can be combined together to validate and verify events as well as providing more coverage than a single tv station. For each media report in our database we require it to be verified by at least one other source with the lower death estimate used for analysis.
What we have found in our analysis is that the statistical patterns remain constant independently of whether the data source is a governmental report, an academic study, a set of media streams or a combination of all three.
Modern media in a warzone like Iraq is a massively distributed network. The writers act like editors and have teams of local stringers that go out and source information about attacks. The two groups are in constant communication via cellphone. The editors job is then to co-ordinate these stringers and incentivize them to find the new stories and each stringer has their own local network of connections that they in turn rely on for information. Thus one editor can cover a large geographical area. When there are multiple bureaus covering a conflict there is intense competition between the different media outlets for new stories and it is through this competition that stories are uncovered.
Media has the advantage of being open-source such that it is available to anyone who can capture and filter an RSS feed. It is also by it’s very nature real-time, such that events are now reported minutes after they happen. Despite the advantages, there is however a need for better coverage of conflict. Traditional media plays a role in this but so too does user generated content, this may come in the form of SMS messages, blog posts, Youtube videos or Twitter updates. I am currently working with groups like Ushahidi, Swift and AliveInAfghanistan to implement crowd sourced news streams in places like Afghanistan. Initiatives of this type will help improve our understanding of events in places that are not well covered by traditional media. With more information coming out of conflict zones we will be able to use this data to better understand the nature and dynamics of war and hopefully this understanding will help us to ultimately reduce the number casualties.
What are some of the specific features of modern insurgent ecosystems as defined by your model?
If we look at the results from our model we find that there are 14 key characteristics that that define a successful insurgent ecosystem; these are listed below with a short name to describe the feature.
- Many body: There are many more autonomous insurgent groups operating within conflicts than we had previously thought. For example there are 100+ autonomous groups operating in Iraq (as of 2006).
- Fluidity: The insurgents are loosely grouped together to form fluid networks with short half-lives. This is very different from the rigid hierarchical networks that have been proposed for insurgent groups.
- Redundancy: If we remove the strongest group from the system another group will rise to replace the previous strongest group
- Splinter: When a group is broken it does not generally split in half but instead shatters into multiple pieces
- Redistribute: When a group is broken the components are redistributed amongst the other groups in the system. The redistribution is biased towards the most successful remaining groups.
- Snowball: The strongest groups grow fastest
- Tall poppy: The strongest groups are the predominant targets for opposition forces
- Internal competition: There is direct competition amongst insurgent groups for both resources and media exposure. They are competing with each other in addition to fighting the stronger counterinsurgent forces.
- Independent co-ordination: Autonomous groups act in a coordinated fashion as a result of the competition that exists between them.
- Emergent structure: Attacks in both Iraq and Colombia become ‘less random’ and more coordinated over time
- Evolution: The strategies employed by the groups evolve over time where successful groups/strategies survive and unsuccessful strategies/groups are replaced.
- High dimensional: Connection occurs over high dimensions (i.e. Internet, cell phone etc) and is not dominated by geographic connections.
- Non-linear: It is approximately 316* times harder to kill 100 people in an attack than it is to kill 10 people. (*Results for a conflict with alpha=2.5).
- Independent clones: the fundamental structure and dynamics of insurgent groups is largely independent of religious, political, ideological or geographic differences.
Links
+ Sean Gourley’s profile on TED.com >>
+ Sean Gourley’s TED Fellows profile >>
+ Learn about the TED Fellows program >>
Comments (7)
Pingback: [Venturebeat] Quid makes million-dollar maps of technology’s past, present… and future | Infocomm Investments
Pingback: OnlineMagazine » Blog Archive » Quid makes million-dollar maps of technology’s past, present… and future
Pingback: Quid makes million-dollar maps of technology’s past, present… and future | VentureBeat
Pingback: The Opportunity Green Conference in Los Angeles: Sustainability Driven by Capitalism, Health Wristbands, and More | Greediocracy
Pingback: TED Blog | Benoit Mandelbrot and his legacy